

We can use many software like SPSS, Excel, Power BI, Anaconda Navigator, R studio for data analysis and visualization. And they have their own unique advantages and disadvantages. Also, even if we think that python is a simple programming language, we can easily solve very complex problems with it.
Why should we choose python?
- Simple and easy to learn
- Being an open source software
- Ability to deal with large dataset.
Due to these reasons, many people in the field today have made data analysis a basic tool using the Python programming language. The fact that experts are recommended in any field, including healthcare, business, and manufacturing, has been another confirmation for it.
My first internship program was for a manufacturing company. They are a giant in the world of making personal protective equipment(PPE). Their use of Python in their data-related work is also a reflection of the above factor.
Python Integrated Development Environment (IDEs)
Python is a programming language. We need an IDE to run it. Below we have given some information about that IDE software.
- Jupiter Notebook
This provides a simple and easy background for data analysis and interactive visualization. This provides facilities for any library, such as NumPy, pandas, matplotlib, and Seaborn. You can easily get Jupiter Notebook by installing Anaconda Navigator, as it comes with the Anaconda distribution.
- Visual Studio Code (VS Code)
In VS Code, you can install the libraries mentioned before, and you have to install some additional extensions to get the output. Even if it is a large dataset, it can be handled easily, but it is not as easy to setup as the Anaconda Navigator Jupiter notebook.
Data analyze and visualisation libraries
Here we mainly focus on NumPy, pandas, matplotlib, & seaborn libraries.
- NumPy
When dealing with a large dataset, we often need to deal with arrays. In this case, the NumPy library becomes an essential factor for us.
Importing the NumPy library

An example of using the NumPy library is given below.

First, an array called ‘data’ has been created, and the squared array, the mean, the sum, and the standard deviation have been obtained. Even if it is a big data set, calculations can be made easier by referring them to an array. In addition, this will help you in the process of building a machine learning model.
- Pandas
The pandas library is helpful for all numeric calculations when working with Python. Also, it is essential for data manipulation, such as data filtering, grouping, and reshaping, as well as handling missing data in the data pre-processing process. will be used.
Importing the Pandas library

An example usage of the Pandas library is given below.
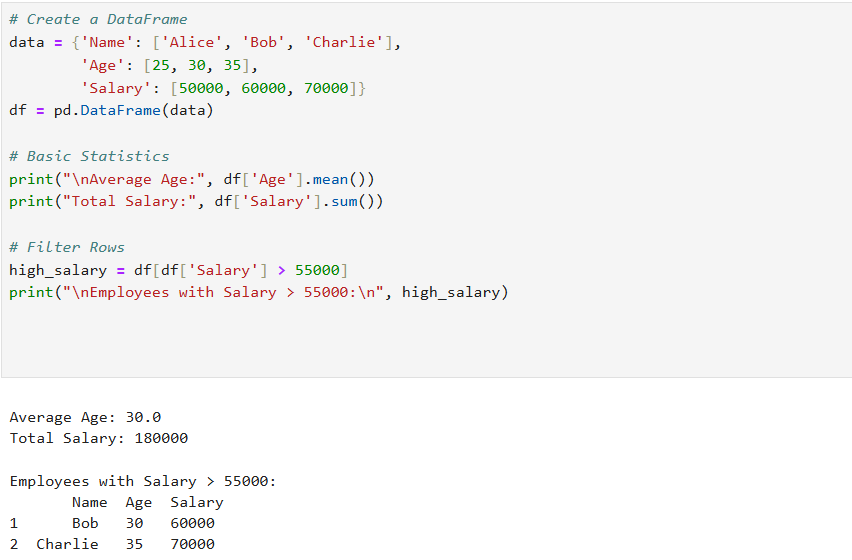
Here a data frame called ‘data’ has been created, and it has been executed in the variable called ‘df’. And the filtering data, manipulation technique has been used for the salary.
- Matplotlib & Seaborn
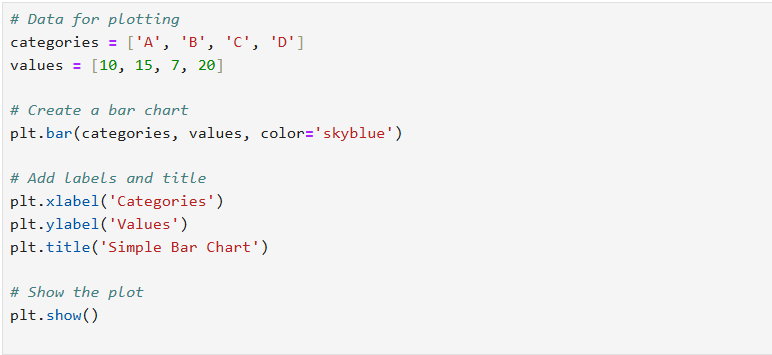
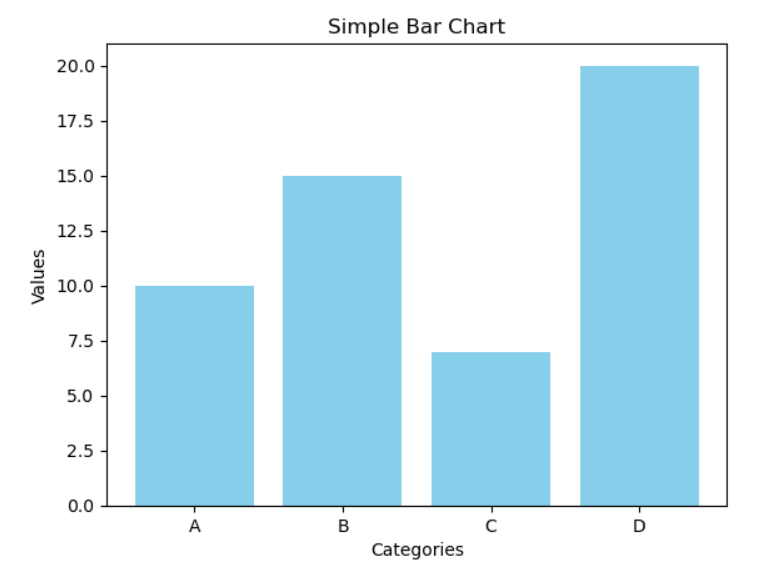
Mainly matplotlib and seaborn libraries are used to visualise data. Here charts like pie charts, bar charts, stacked bar charts, scatter plots, and histograms can be created even for a large dataset. Also, charts can be customised by labels and legends. You can get an interactive visualisation.
Importing the Matplotlib library
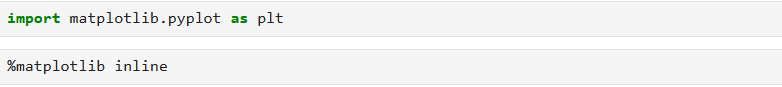
Here the output chart visualisation by ‘%matplotlib inline’ is displayed in this tab itself, and no additional tab is opened. An example of using the Matplotlib library is given below.
Importing the Seaborn library

Seaborn is a sub-library of the Matplotlib library and can be visualised heatmap, pair plot, violin plot, etc.
Comparison between matplotlib and seaborn
Long codes are often used in matplotlib to customise plots, but since seaborn has built-in default features, long code lines are not needed.
Also, in Matplotlib we can customise font sizes, labels, and legends as needed, but in Seaborn customisation is limited. In Matplotlib, plots can be drawn in a wide range, such as line plots, scatter plots, and histograms, but in Seaborn, heatmaps, pair plots, and regression plots are often used for statistical analysis.
Conclusion
Python is a big help in the process of visualising the raw data that we take in a way that we can make decisions. Also, robust libraries that we need to perform any kind of analysis are available in Python. There is a large community that uses this, so we have the ability to solve existing problems later that way.