

Introduction to Data Science
Data science makes a significant contribution to solving the complex problems of today’s world by leveraging data. It helps identify patterns in business activities and facilitates informed decision-making. The evolution of data science is driven by advancements in technology, interdisciplinary growth, and the increasing demand for actionable insights. One of the most notable transformations in this field is the shift from traditional statistical methods to modern machine learning and artificial intelligence (AI).
The Origins of Data Analysis
The origins of data science are deeply rooted in statistics and probability theory. Probability theory began with the study of gambling in the distant past, specifically in the 17th century, when people sought to calculate the probability of winning games. To formalize these probabilities using scientific methods, Christiaan Huygens published a research paper in 1657.
In 1805, Carl Friedrich Gauss introduced the least squares method, a powerful technique used to find the best-fitting line in data and widely applied in regression analysis.
In the 1920s, Ronald A. Fisher laid the foundation for hypothesis testing and analysis of variance (ANOVA). At the time, his goal was to analyse factors affecting agricultural yields. Over time, ANOVA extended beyond agriculture to fields such as engineering, biology, medicine, and economics. The concept of ANOVA is used to compare datasets to determine whether their group means are significantly different.
By the 1930s, researchers became increasingly interested in analysing the interactions between variables, particularly how one variable might depend on another.
Example:
The sales of a product, such as Product X, may depend on customer location and advertising types (e.g., TV, Facebook ads, or Instagram ads). Additionally, advertising effectiveness varies by location. For instance, areas without internet access cannot leverage Facebook or Instagram ads. This dependency highlights how advertising strategies must adapt based on location.
The Age of Computers: A New Era in Data Processing
Around the 1950s, the development of electronic computers enabled the processing of large datasets, marking the birth of data science. In 1970, Edgar F. Codd introduced the concept of relational databases, which organize data into tables connected by relationships. Relational databases have become indispensable across various industries due to their efficiency, scalability, and security.
The Foundations of Modern Data Science Tools
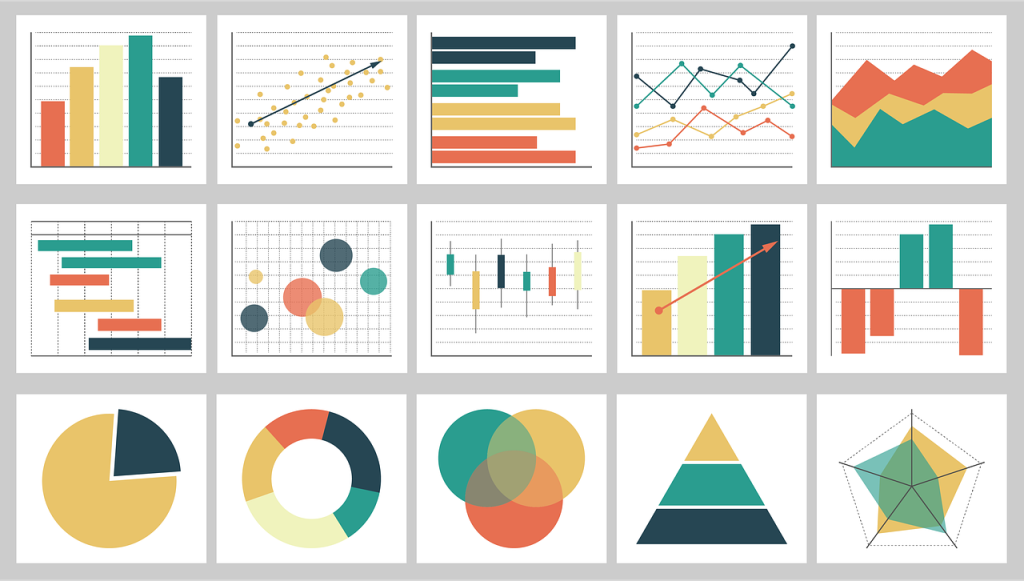
Tools like SPSS (introduced in 1968) enhanced the power of statistical analysis and enabled data visualization through various types of plots:
For Distribution – Histogram, Density Plot, Box Plot
For Relationship – Scatter Plot, Line Plot
For Categorical Data – Bar Chart, Stacked Bar Chart, Pie Chart
Artificial Intelligence and Machine Learning: Data’s Next Frontier
The ‘Dartmouth Summer Research Project‘ workshop on artificial intelligence(AI) was held at Dartmouth College in 1956. The project consider as the, first time word ‘Artificial Intelligence’ was used and main purpose to create machines that can learning from data.
In AI procedure, the first step is data collection and pre processing. Then we use technique like supervised learning and unsupervised learning. AI models trained by using mathematical functions and it improve accuracy of model. Then we can forecast future values with new data. After build advanced AI model, they get feedback from users to improve their ability and change the behaviour.
Ex-chatbot
The Rise of Data Mining
In 1980, data mining techniques were marked significant improvement of data field. Data mining is the process of identifying patterns, insights from given large datasets. The development od computational power most affect to to this area and we are using classification, clustering, regression and sequential pattern techniques for solving problems. The big data era began with development with internet and social media. These massive datasets use to analyse how peoples behaviour on non restriction area.
Data Science Is Born: Connecting Data, Tools, and Intelligence
In 2001, data science word formally introduced. The python and R programming languages, data visualization tools like tabular become essential tools for data science in these days. Nowadays, Data Science is wide area technological advance field that based on machine learning(ML) and AI. It’s help to automate data analysis prediction process.
Traditional Data Science
- In the past, the data science industry primarily worked with structured datasets. Data resources were limited, and storage costs were high. Tools like Excel and SPSS were the basic options for analysis. The method was entirely manual: substitute values into explanatory variables and derive results for response variables. Data visualization relied on tools like Excel and PowerPoint, with representations such as bar charts and pie charts. Data scientists identified patterns and drew conclusions. Automation was minimally used in the process.
Modern Data Science
- After 2010, modern data science evolved to handle large datasets and diverse data sources. Platforms like cloud computing enable the management of big data with minimal errors. Modern innovations include machine learning frameworks like TensorFlow and Scikit-learn, which are used to build models. Additionally, the availability of large GPU units has significantly improved computational power and efficiency.
- Data visualization tools have advanced from traditional options to modern platforms like Tableau, Power BI, and Plotly. Machine learning and AI have automated processes such as data cleaning, analysis, and conclusion generation. Predictive ML models can be trained and continuously learn from new data. However, ethical concerns about personal data have emerged. As a result, governments are working to establish stricter privacy laws to address these issues.